World Meteorological Organization
December 2, 2020
2020 will likely be one of three warmest years on record, according to the provisional 2020 WMO State of the Global Climate report. Ocean heat is at record high levels. Extreme heat, wildfires and floods, as well as a record-breaking Atlantic hurricane season, have affected millions of people. Climate impacts are compounding threats to human health, security and economic stability posed by COVID-19. Even with pandemic lockdowns slowing economic activity, atmospheric concentrations of greenhouse gases continued to rise.
Geneva, Switzerland | 2 December 2020 (WMO) – Climate change continued its relentless march in 2020, which is on track to be one of the three warmest years on record. 2011-2020 will be the warmest decade on record, with the warmest six years all being since 2015, according to the World Meteorological Organization.
Ocean heat is at record levels and more than 80% of the global ocean experienced a marine heatwave at some time in 2020, with widespread repercussions for marine ecosystems already suffering from more acidic waters due to carbon dioxide (CO2) absorption, according to the provisional WMO report on the State of the Global Climate in 2020.
The report, which is based on contributions of dozens of international organizations and experts, shows how high-impact events including extreme heat, wildfires and floods, as well as the record-breaking Atlantic hurricane season, affected millions of people, compounding threats to human health and security and economic stability posed by the COVID-19 pandemic.
Despite the COVID-19 lockdown, atmospheric concentrations of greenhouse gases continued to rise, committing the planet to further warming for many generations to come because of the long lifetime of CO2 in the atmosphere, according to the report.
For the first time, WMO compiled a simple story map with key indicators of the changing climate.
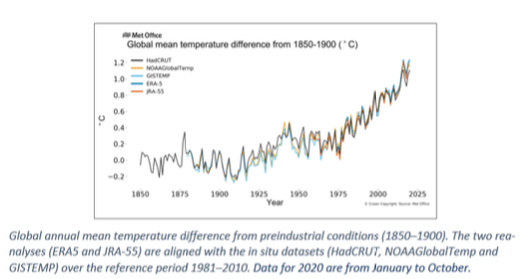
“The average global temperature in 2020 is set to be about 1.2 °C above the pre-industrial (1850-1900) level. There is at least a one in five chance of it temporarily exceeding 1.5 °C by 2024,” said WMO Secretary-General Prof. Petteri Taalas.
“This year is the fifth anniversary of the Paris Agreement on Climate Change. We welcome all the recent commitments by governments to reduce greenhouse gas emissions because we are currently not on track and more efforts are needed.”
“Record warm years have usually coincided with a strong El Niño event, as was the case in 2016. We are now experiencing a La Niña, which has a cooling effect on global temperatures, but has not been sufficient to put a brake on this year’s heat. Despite the current La Niña conditions, this year has already shown near record heat comparable to the previous record of 2016,” said Prof. Taalas.
“2020 has, unfortunately, been yet another extraordinary year for our climate. We saw new extreme temperatures on land, sea and especially in the Arctic. Wildfires consumed vast areas in Australia, Siberia, the US West Coast and South America, sending plumes of smoke circumnavigating the globe. We saw a record number of hurricanes in the Atlantic, including unprecedented back-to-back category 4 hurricanes in Central America in November. Flooding in parts of Africa and South East Asia led to massive population displacement and undermined food security for millions,” he said.
The 2020 provisional State of the Global Climate report is based on temperature data from January to October. The final 2020 report will be published in March 2021. It incorporates information from National Meteorological and Hydrological Services, regional and global climate centres and United Nations partners including the Food and Agriculture Organization of the United Nations (FAO), International Monetary Fund (IMF), Intergovernmental Oceanographic Commission of UNESCO (UNESCO-IOC), International Organization for Migration (IOM), the United Nations Environment Programme (UNEP), UN High Commissioner for Refugees (UNHCR), and the World Food Programme (WFP).
Temperatures and Heat
The global mean temperature for January to October 2020 was around 1.2°C above the 1850–1900 baseline, used as an approximation of pre-industrial levels. 2020 is very likely to be one of the three warmest years on record globally. Modern temperature records began in 1850.
The WMO assessment is based on five global temperature datasets. All five of those datasets currently place 2020 as the 2nd warmest for the year to date, following 2016 and ahead of 2019. The difference between the warmest three years is small, however, and exact rankings for each data set could change once data for the entire year are available.
The most notable warmth was observed across northern Asia, particularly the Siberian Arctic, where temperatures were more than 5 °C above average. Siberian heat culminated in late June, when it reached 38.0 °C at Verkhoyansk on the 20th, provisionally the highest known temperature anywhere north of the Arctic Circle. This fuelled the most active wildfire season in an 18-year long data record, as estimated in terms of CO2 emissions released from fires.
Sea ice
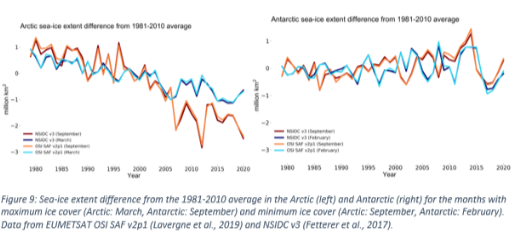
Since the mid-1980s, the Arctic has warmed at least twice as fast as the global average, reinforcing a long downward trend in summer Arctic sea ice extent which has repercussions on the climate in mid-latitude regions.
Arctic sea-ice reached its annual minimum in September, as the second lowest in the 42-year-old satellite record. Arctic sea ice for July and October 2020 was the lowest on record.
Sea-ice in the Laptev Sea [above Russia] has been exceptionally low through the spring, summer and autumn, and the Northern Sea Route was ice-free or close to ice free from July to October 2020.
Antarctic ice in 2020 was close to or slightly above the 42-year mean. Greenland continued to lose ice, losing 152 Gt of ice this year, despite a slower rate than 2019.
Sea-level rise and ocean heat
Ocean heat content for 2019 was highest on record in the datasets going back to 1960. There is a clear signal for faster heat uptake in recent decades. More than 90% of the excess energy accumulating in the climate system as a result of increased concentrations of greenhouse gases goes into the ocean.
On average, since early 1993, the altimetry-based global mean rate of sea level rise amounts to 3.3 ± 0.3 mm/yr. The rate has also increased over that time. A greater loss of ice mass from the ice sheets is the main cause of the accelerated rise in the global mean sea level.
Global mean sea-level in 2020 is similar to that in 2019, and consistent with the long-term trend. Developing La Niña conditions have led to a recent small drop in global sea level, similar to the temporary drops associated with previous La Niña events.
As with heatwaves on land, extreme heat can affect the near-surface layer of the oceans with a range of consequences for marine life and dependent communities.
Satellite retrievals of sea-surface temperature are used to monitor marine heatwaves, which can be categorized as moderate, strong, severe or extreme. Much of the ocean experienced at least one ‘strong’ marine heatwave at some point in 2020. The Laptev Sea experienced an extreme marine heatwave from June to October. Sea ice extent was unusually low in the region and adjacent land areas experienced heatwaves during the summer.
Ocean acidification is increasing. The ocean absorbs around 23% of the annual emissions of anthropogenic CO2 from the atmosphere, thereby helping to alleviate the impacts of climate change on the planet. The ecological costs of this process to the ocean are high, as the CO2 reacts with seawater lowering its pH; a process known as ocean acidification. There is decline in average pH at the available observing sites between 2015 and 2019, the last year for which data are currently available. A wider variety of sources including measurements of other variables shows also a steady increase in the global ocean acidification
High Impact Events
Floods
Severe flooding affected many millions of people in East Africa and the Sahel, South Asia, China and Viet Nam.
In Africa – Sudan and Kenya were the worst hit, with 285 deaths reported in Kenya and 155 in Sudan. Lake Victoria reached record levels in May, the Niger and Nile rivers reached record levels at Niamey (Niger) and Khartoum (Sudan). Flooding also contributed to an ongoing locust outbreak.
In South Asia – India experienced one of the two wettest monsoon seasons since 1994. August was the wettest month on record for Pakistan, and widespread flooding was observed throughout the region (including Bangladesh, Nepal and Myanmar).
In China – Persistent high rainfall in the Yangtze River catchment during the monsoon season also caused severe flooding. Reported economic losses exceeded US$15 billion, and at least 279 deaths were reported during the period.
In Viet Nam – Heavy rains typical of the arrival of the northeast monsoon were exacerbated by a succession of tropical cyclones and depressions, with eight making landfall in less than five weeks.
Heat, drought and fires
In the interior of South America, severe drought affected many parts in 2020, with the worst-affected areas being northern Argentina, Paraguay and the western border areas of Brazil. Estimated agricultural losses were near US$3 billion in Brazil alone. There was significant wildfire activity across the region, most severe in the Pantanal wetlands of western Brazil.
In the USA, the largest fires ever recorded occurred in late summer and autumn. Widespread drought and extreme heat contributed to the fires, and July to September were the hottest and driest on record for the southwest. Death Valley in California reached 54.4 °C on 16 August, the highest known temperature in the world in at least the last 80 years.
In the Caribbean, major heatwaves occurred in April and September. Temperatures reached 39.7 °C at Veguitas on 12 April, a national record for Cuba, whilst Havana also had its hottest day with 38.5 °C.
Australia broke heat records in early 2020, including the highest observed temperatures in an Australian metropolitan area, in western Sydney when Penrith reached 48.9 °C on 4 January.
Europe experienced drought and heatwaves, although these were generally not as intense at in 2019. In the eastern Mediterranean with all-time records set in Jerusalem (42.7 °C) and Eilat (48.9 °C) on 4 September, following a late July heatwave in the Middle East in which Kuwait Airport reached 52.1 °C and Baghdad 51.8 °C.
Tropical Cyclones and storms
The number of tropical cyclones globally was above average in 2020, with 96 cyclones as of 17 November in the 2020 Northern Hemisphere and 2019-2020 Southern Hemisphere seasons.
The North Atlantic region had an exceptionally active season, with 30 tropical cyclones as of 17 November, more than double the long-term average (1981-2010) and breaking the record for a full season, set in 2005. At a time when the season is normally winding down, two Category 4 hurricanes made landfall in Central America in less than two weeks in November, resulting in devastating flooding and many casualties.
Cyclone Amphan which made landfall on 20 May near the India-Bangladesh border was the costliest tropical cyclone on record for the North Indian Ocean, with reported economic losses in India of approximately US$14 billion. Large-scale evacuations of coastal areas in India and Bangladesh helped to lower casualties compared to previous cyclones in the region.
Risks and impacts
Approximately 10 million displacements, largely due to hydro-meteorological hazards and disasters, were recorded during the first half of 2020, mainly concentrated in South and South-east Asia and the Horn of Africa. In 2020, the COVID-19 pandemic has added a further dimension to human mobility concerns.
The COVID-19 pandemic has added also another layer of risk to evacuation, recovery and relief operations related to high-impact events. In the Philippines, for example, although over 180 000 people were pre-emptively evacuated ahead of Tropical Cyclone Vongfong (Ambo) in mid-May, the need for social distancing measures meant that residents could not be transported in large numbers and evacuation centres could only be used at half capacity.
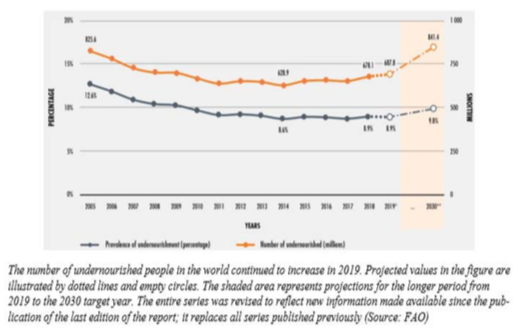
After decades of decline, the recent increase in food insecurity since 2014 is driven by conflicts and economic slowdown as well as by climate variability and extreme weather events. Nearly 690 million people, or 9% of the world population, were undernourished and about 750 million experienced severe levels of food insecurity in 2019 according to the latest FAO data. The number of people classified under crisis, emergency and famine conditions had increased to almost 135 million people across 55 countries.
The Number of Undernourished People in the World Continued to Increase in 2019
According to FAO and WFP, over 50 million people have been hit twice: by climate related disasters (floods, droughts and storms) and the COVID-19 pandemic in 2020.
Countries in Central America are suffering from the triple-impact of hurricanes Eta and Iota, COVID-19 and pre-existing humanitarian crises. The Government of Honduras estimated that 53 000 hectares of cropland were washed away, mainly rice, beans, and sugarcane.
Negative environmental effects include impacts on land such as droughts, wildfires in forest and peatland areas, land degradation, sand and dust storms, desertification and air pollution, with far reaching implications for nature and wildlife. Impacts on marine systems include sea level rise, ocean acidification, reduced levels of ocean oxygen, mangrove decay and coral bleaching.
Lessons and opportunities for enhancing climate action
According to International Monetary Fund, the current global recession caused by the COVID-19 pandemic makes it challenging to enact the policies needed for mitigation, but it also presents opportunities to set the economy on a greener path in order to boost investment in green and resilient public infrastructure, thus supporting GDP and employment during the recovery phase.
Digital assets are available here and Story Map is available here .
For further information contact: Clare Nullis, media officer. Email: cnullis@wmo.int.
Cell: 417 970-91397
Notes for Editors
Information used in this report is sourced from a large number of National Meteorological and Hydrological Services (NMHSs) and associated institutions, as well as Regional Climate Centres, the World Climate Research Programme (WCRP), the Global Atmosphere Watch (GAW) and Global Cryosphere Watch. United Nations partners include the Food and Agriculture Organization of the United Nations (FAO), International Monetary Fund (IMF), Intergovernmental Oceanographic Commission of UNESCO (UNESCO-IOC), International Organization for Migration (IOM), the United Nations Environment Programme (UNEP), UN High Commissioner for Refugees (UNHCR), and the World Food Programme (WFP)
WMO extends its gratitude for all the dedicated hard work which makes this report an authoritative source of information on the state of the climate and on climate impacts.
Global mean temperature is reported as the mean of five data sets listed below. Global mean temperature anomalies are expressed relative to the 1850-1900 average.
WMO uses datasets (based on monthly climatological data from observing sites of the WMO Members) developped and maintained by the United States National Oceanic and Atmospheric Administration, NASA’s Goddard Institute for Space Studies, and the United Kingdom’s Met Office Hadley Centre and the University of East Anglia’s Climatic Research Unit in the United Kingdom.
Internationally recognized datasets are used for all other key climate indicators. Full details are available in the provisional report.
The World Meteorological Organization is the United Nations System’s authoritative voice on Weather, Climate and Water