The Orthodox Church uses Scripture and theology, the witness of the saints and fathers, as well as physical conditions to determine its perspective.
The science of climate change in outline is both simple and highly complex. Four major gases make up the world’s atmosphere: Nitrogen, the most common; oxygen; argon; and carbon dioxide. A few other gases are less present. Carbon dioxide is different than the other three because it is “a greenhouse gas.” This means it retains heat and moisture. Greenhouse gases are important because they allow the planet to hold the sun’s warmth. As CO2 levels increase, too much heat is retained. This causes higher temperatures and higher humidity levels. Any person should be able to comprehend this basic description of Earth’s atmosphere.
To understand the methods involved in climate science, consider a visit to the family doctor. A physician uses personal data, called “biometrics,” to assess a patient’s health. Biometrics are the measurements of the pulses and pressures and chemicals within the body. These objective measurements are compared with standards and inform the doctor about the state of a person’s health. Simple measurements inform the doctor of the general health of a patient. To probe deeper into a person’s health, a complexity is also possible with more analysis and familiarity with the body.
Climate science is similar. The method used by a medical doctor to determine patient health is parallel to the method climate scientists use to discern planetary health. Just as a range exists for healthy blood pressure or body temperature, a range also exists and is known for a healthy atmosphere. Objective measurements reveal dangerous levels of carbon dioxide. These determinations are discerned by instruments and precise measurements.
This comparison between personal health and planetary health introduces this section on the science of climate change. Scientific measurements combined with real world experiences are alerting scientists – and each of us, if we are paying attention – to the serious challenge of global climate change. The following simple, high school level charts and graphs as developed by government and university scientists portray the rise of carbon dioxide and describe how global climate change is happening now. The scientific assessments and conclusions about climate change are based on measurements and science, not on philosophy, opinions or politics.
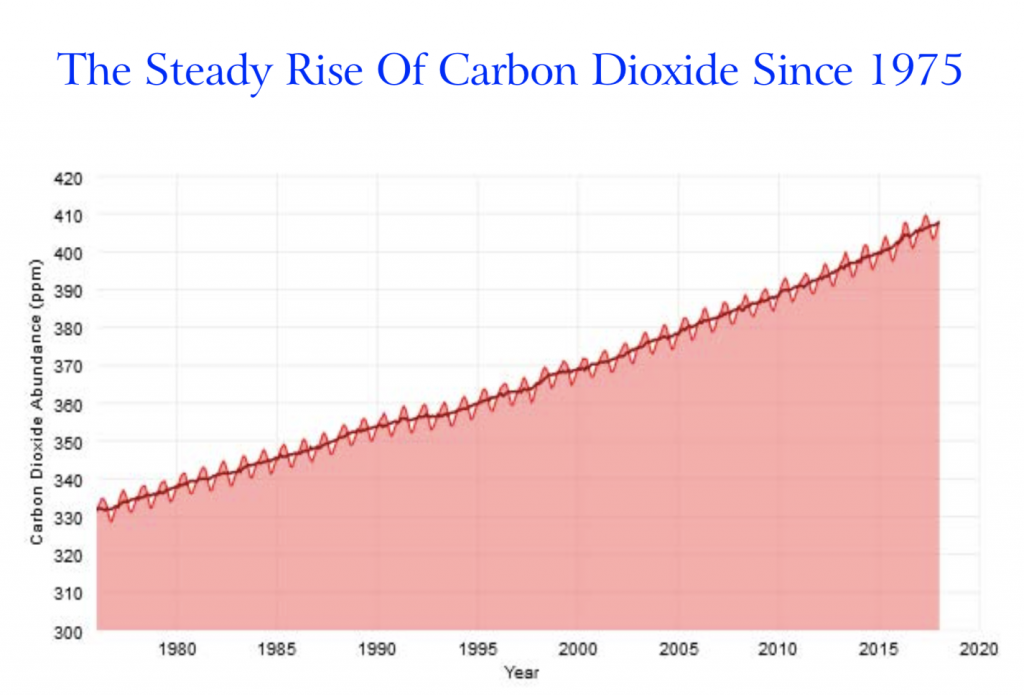
Carbon dioxide (CO2) levels are steadily increasing. There is no controversy over this measurement. The exact same measurements come from observatories around the world. The chart above shows that since 1975, there has been a gradual increasing of carbon dioxide in the world’s atmosphere.
In 2016 the National Oceanic and Atmospheric Administration (NOAA) together with the American Meteorological Society issued a report on the State of the Climate. They found that the amount of CO2 in the atmosphere has been going up at an increasing rate since 1960. They reported:
The global growth rate of atmospheric CO2 has risen from 0.6 ppm (parts per million) per year in the early 1960’s to an average of 1.7 ppm per year during the previous ten years.
Now in 2019 the CO2 rate of increase has risen to 2.1 ppm. This is the largest rate of increase observed in the 58-year atmospheric measurement record.
This rate of increase in carbon dioxide over the past 60 years is 100 times faster than the highest historic increases, such as those that occurred at the end of the last ice age which was roughly 15,000 years ago.
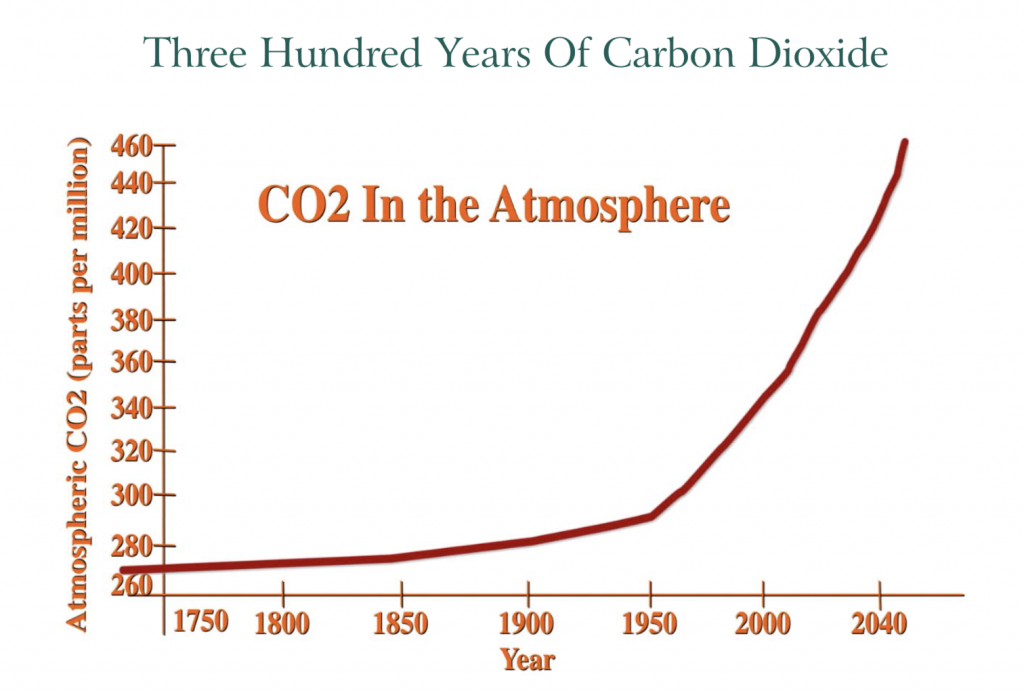
Here is a longer view of the rise of carbon dioxide. Its level in the atmosphere began to rise after the onset of the Industrial Revolution, but the pace of increase was gentle and gradual. After World War II, fossil fuel use accelerated to meet demands for post-war production, consumerism and economic growth. As fossil fuel use skyrocketed, so did CO2 as its byproduct. This is why the rate of CO2 increase soars so sharply after 1950.
Carbon dioxide is a greenhouse gas. This means it absorbs heat. Earth’s land and ocean surfaces, warmed by sunlight, radiate a moderate amount of heat energy. Unlike oxygen or nitrogen, greenhouse gases absorb heat and gradually release it over time. Without this natural greenhouse effect, Earth’s average temperature would be below freezing instead of close to 60° F.
While greenhouse gases are critical for our planet to maintain an even temperature, if they get out of balance and increase, they then retain too much of the sun’s warmth and that throws the earth’s climate into turmoil. This sets up a new climate regime that is warmer and much more turbulent. This is precisely what is now happening.
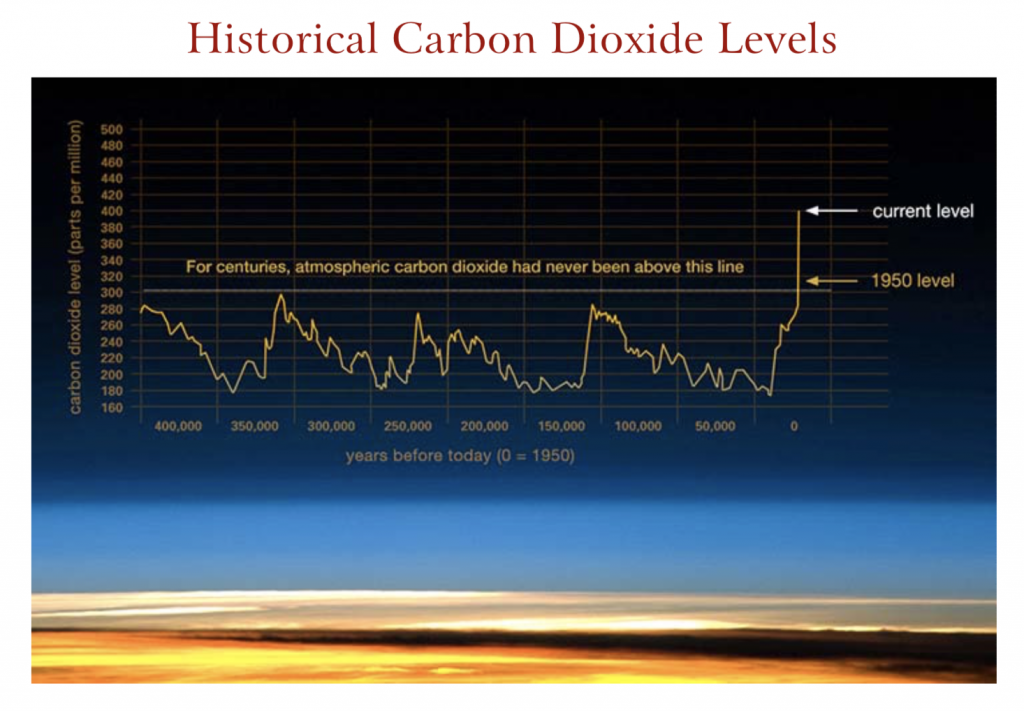
This chart from NASA reviews the rise and fall of carbon dioxide over the past 400,000 years. Climate science precisely measures this information through ice core samples in Greenland and elsewhere in polar regions.
Notice the rhythmic pulse in the rise and fall of carbon dioxide levels. The concentration of CO2 is vertically displayed at the far left. What is most significant in the rise and fall of CO2 is that when carbon dioxide levels fall below 200 ppm, this has triggered an ice age. When carbon dioxide levels rise above 280 ppm, the ice melts and an inter-glacial warming period emerges.
In 1950 as industrial activity reached new levels, the world crossed the threshold into a level above 300 ppm. A substantial lag time exists between the change in CO2 levels and global temperatures. As of 2012, the atmosphere of the world for the first time soared above the 400 ppm level. Now in 2019 we are seeing stronger storms, increases in temperature, more catastrophic fires, and more rapid melting of the polar ice caps. These signs are the inevitable consequences of rising levels of carbon dioxide. As IPCC scientists declare, “the scientific evidence for warming of the climate system is unequivocal.”
Global Temperatures Are On A Steep Rise
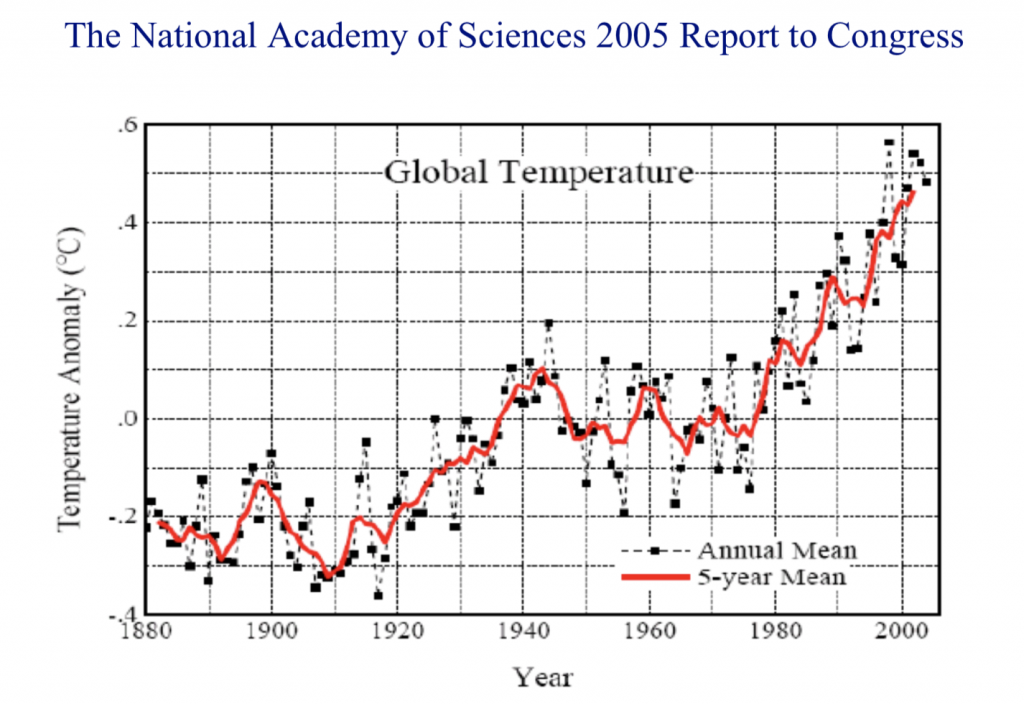
In 2005 America’s top scientists at The National Academy of Sciences presented this graph to Congress. It displays the steady increase in average global temperatures, especially since 1980. When this temperature data is correlated with the rise of carbon dioxide, a tight correlation emerges. As CO2 levels rise, so do average temperatures, and so do many forms of climate disruption.
In the years since this report was presented, CO2 levels and average global temperatures have continued to rise.
The biggest surprise contained in this data is that the increasing levels of temperature and greenhouse gases are taking place at a rate that is substantially faster than what scientists originally predicted.
One of the implications of this rise is that people born roughly after 1960 and successive years will witness the great extremes and traumas of climate that scientists have predicted and that are already being experienced in the Arctic and tropical regions of the planet… and very soon everywhere.
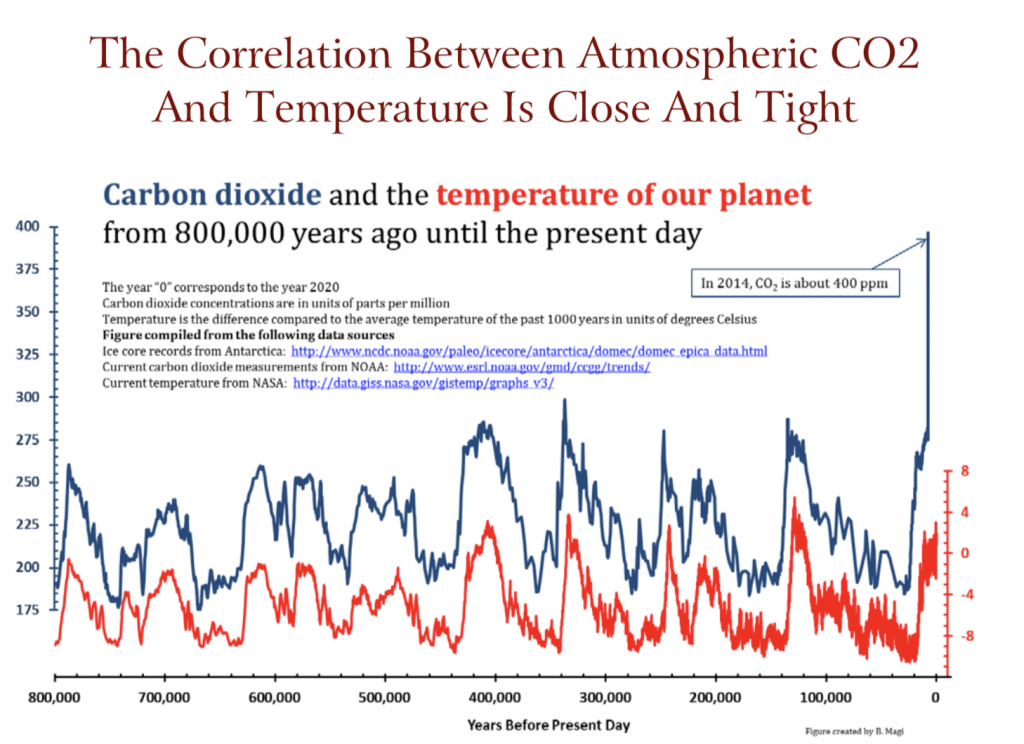
This graph represents 800,000 years of CO2 and temperature history. Notice that over 8,000 centuries, the level of carbon dioxide never exceeded 300 parts per million – until now. Today, because CO2 measures over 400 parts per million and is still climbing, what do you think this tells us about what will follow?
Study this chart in detail. The blue line tracks the rise and fall of CO2. The red line plots the rise and fall of average global temperatures. What is most significant is the tight correlation between the rise of carbon dioxide and the consequent rise in average global temperatures. As CO2 levels go up, temperature follows and goes up. What we see then is an in-step march between CO2 and average global temperature. This is what science predicts will happen and this is exactly what is being observed in higher average global temperatures.
The lesson here is that if we want a stable climate into the future, we should act now and do everything possible to slow the rise of CO2 into the atmosphere. If we fail to heed this warning, we will leave a legacy of sea rise, stronger storms, increased heat, polar ice melt, and great turmoil for many generations to come.
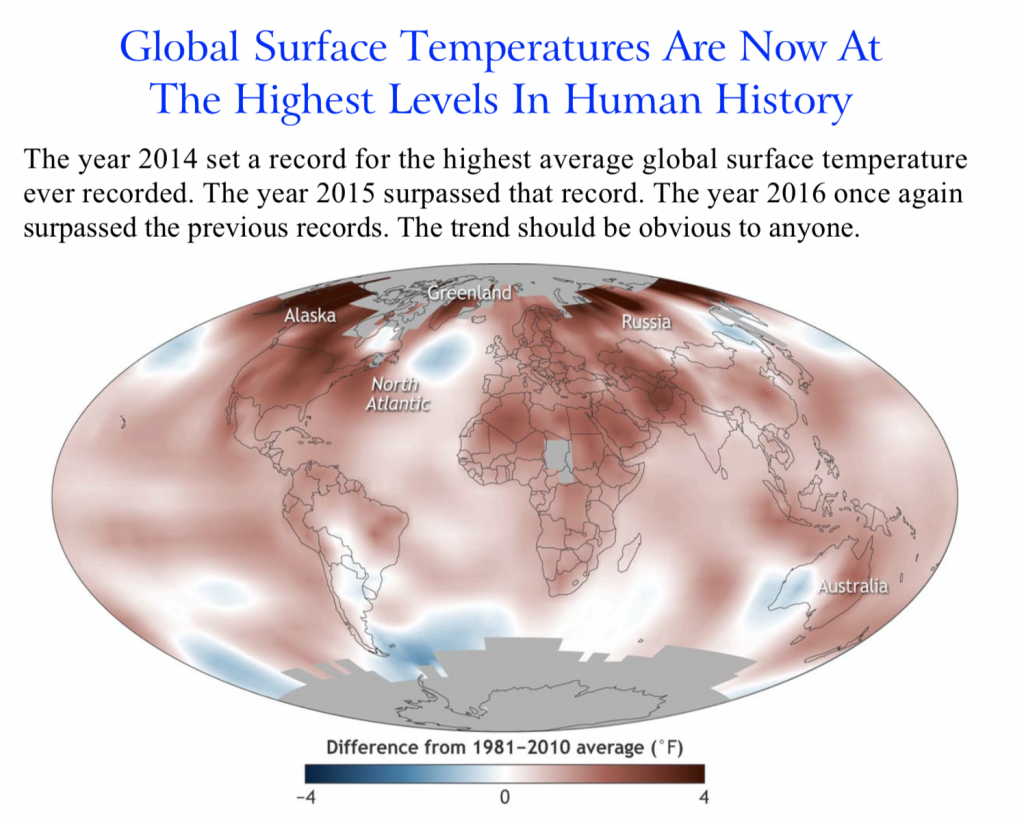
Earth’s 2016 surface temperatures were the warmest since modern record keeping began in 1880, according to NASA and NOAA.
The consequences of higher CO2 levels are warmer temperatures. A chain of consequences now follows. Polar ice caps are melting, causing rising sea levels. This displaces people in coastal areas and low-lying islands. Higher temperatures cause more moisture in the atmosphere which results in more intense rainfall, including torrential downpours and record-breaking floods. Higher temperatures dry out forests causing an increase in cataclysmic forest fires. As oceans absorb more warmth, this causes more powerful hurricanes and storms. About one-third of the carbon dioxide mixes into the ocean where it causes carbonic acid.
The world’s oceans are now 30% more acidic than fifty years ago. This in combination with warmer oceans causes coral reefs to bleach and die. This creates a wave of extinctions to sweep across the bottom of the ocean food chain. As land temperatures break all time heat records, so do the world’s oceans.
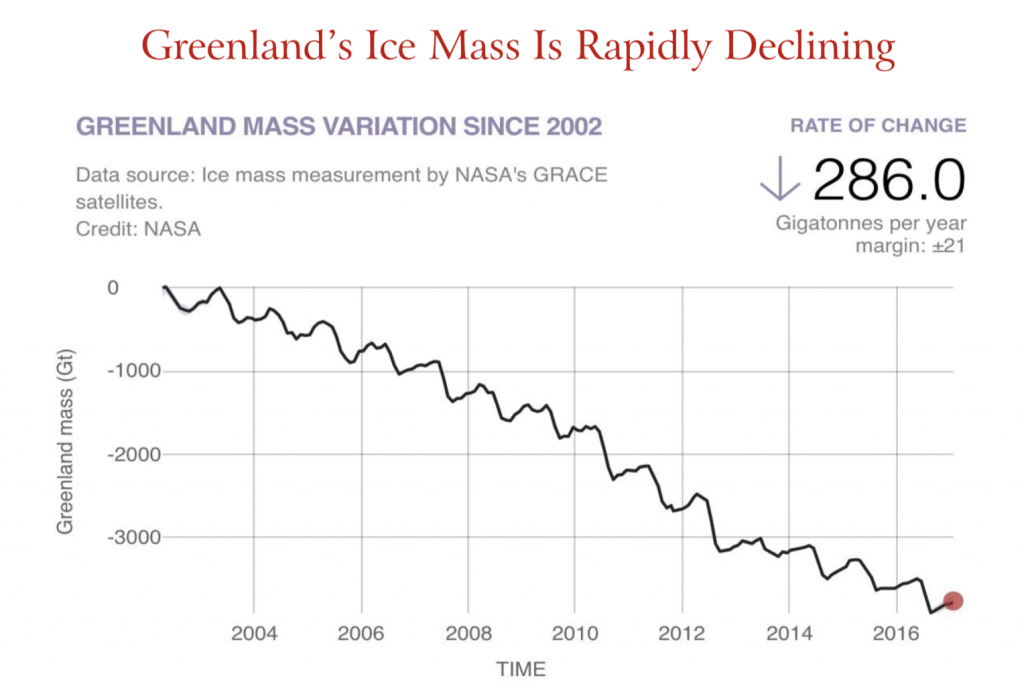
The chart above describes the rapid and steady decline of ice mass and cover on Greenland over the fifteen-year period from 2002 to 2017.
“We are seeing what scientists have predicted for years,” said Professor of Thermal Sciences John Abraham (via email). “The temperatures in the Arctic are off the chart. This matters for the rest of us because this is the time of year when the Arctic ice should be growing. But it isn’t growing like it should. So, this summer, there will be less ice and more open waters that will lead to even more warming.”
In light of the lack of aggressive action to address climate change, John Abraham warns that “We’ve started a feedback loop that we cannot stop.”
And indeed, Arctic sea ice levels shrank to record lows during most of 2018, according to Japan’s National Institute for Polar Research.
“What is particularly frightening is that this is happening in a La Niňa year, when if anything, the Earth should be cooler than normal,” Abraham added. “If this isn’t a clarion call to take action, I don’t know what is.”
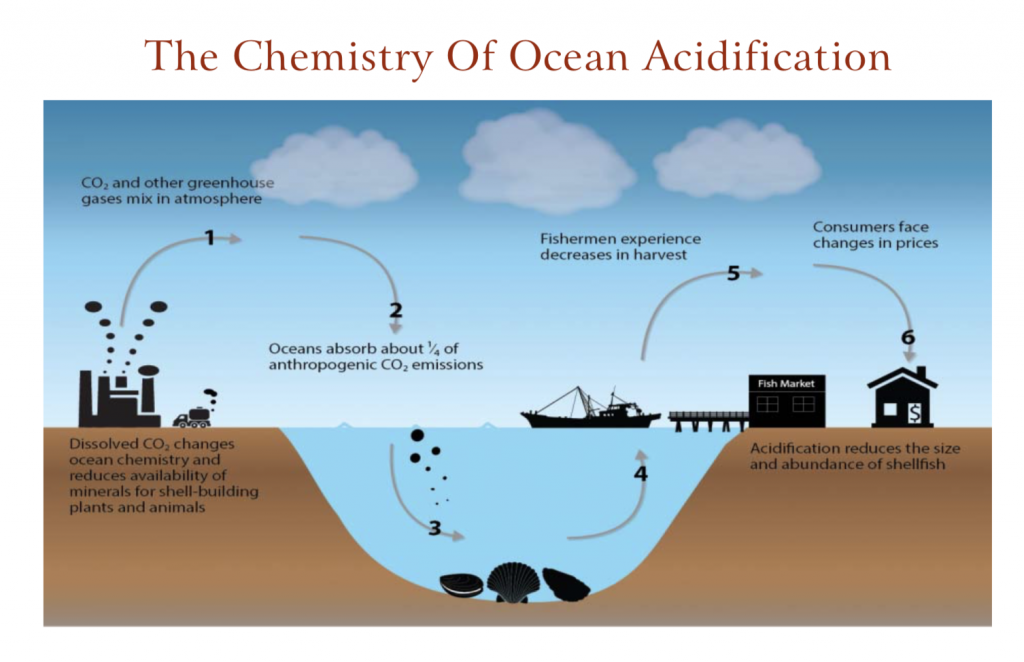
The increase of carbon dioxide in the atmosphere is changing the chemical composition of seawater, especially in colder basins like the North Pacific where carbon dioxide dissolves more readily. This change in ocean chemistry is threatening the health of many marine species, and posing risks to those who depend on oceans for their livelihood. In the Pacific Northwest, the farmed oyster industry has already lost shellfish worth $110 million, causing the loss of over 3,200 jobs. Sixteen other US coastal regions are also impacted.
Across the U.S., coastal communities earn over $1 billion from shellfish. Now 16 out of 23 of these regions are facing “rapid acidification.” Large areas of the oceans along the U.S. West Coast, the Bering Sea and the Arctic Ocean will become difficult for calcifying animals within the next 50 years. A recent study found that even New England lobster and Alaskan red king crab may soon be affected by the rapid acidification of seawater. This has huge implications for lucrative U.S. seafood exports and regional economies.
Coral reefs will be hit hard. They provide key ecosystem services to countless marine species. If they decline because of accelerating acidification, the result will be less productive oceans. Dead and dying coral reefs are already causing increased economic hardship for coastal populations.